


Mobile Commerce is driving digital experience
Insights from the 2021 Digital Experience Benchmark report by Contentsquare

64% of total traffic comes from mobile.
In 2020, the mCommerce experience continued to expand. Mobile still drives the bulk of online traffic across all industries, with 64% of online visits coming from smartphones, a +16% increase from 2019.
Other than financial services and B2B, most of the industries have been mobile-first. The luxury sector, in particular, seemed to dominate the mobile traffic share last year, with 76% of the industry’s visits originating from a mobile device – an interesting shift for an industry known for its in-person customer service and experience.
Be it Grocery, Beauty, Consumer Electronics, and Apparel for all the daily requirements of a consumer mobile has become the first choice of commerce.

The above data has been provided by Contentsquare for its 2021 Digital Experience Benchmark study.
“For this report, we used Contentsquare’s database of 900+ global brands to collect over 20+ billion individual user sessions from January 1, 2020, to December 31, 2020. We collected and analysed data from desktop, mobile, tablet, and mobile app interactions and sessions across 10 industries to learn more about the evolution of online experience and quantify the impact COVID-19 had on businesses last year.”
Earned media is a huge driver of traffic
Contentsquare highlights that 56% were returning users across all industries. It is a good metric especially when almost every marketer lists ‘Acquisition’ as the biggest challenge.
However, my interest area was to find what are the acquisition sources. “80% of the traffic is from earned sources.” Even if we take the percentage with a pinch of salt since everyone wants to look good in the real world, still it is better.
In 2019 according to Contentsquare: “65% of traffic originated from earned sources, which we attributed to increased brand awareness and repeat visits for regular purchases. That doesn’t seem to be the case this year. It’s important to remember that 2020 was an unprecedented year for advertising. Compared to 2019, paid traffic saw a -43% decrease in 2020, jumping from 35% to 20%.”
Direct shows the reason why we have repeat users because at some level consumers are connecting with the brands. But “2% Organic Social.” Organic Reach on social media(Facebook) started dying in 2016.

While the above data is the result of the pandemic but more or less this has been the scene even in India. If you look at the media spends by Indian marketers then it has been dominated by - Video, Social, and Search. And it goes without saying that Mobile will be the preferred device for consumers and hence for marketers.
Miserable Bounce Rate
The report also dwells on the topic - ‘Bounce Rate.’
“First impressions matter, especially when 47% of website visitors are abandoning their journeys after viewing just one page on a website. That means almost 1 in 2 visitors would rather leave than spend time on your site. Ouch.”
The sector that still prefers the web over mobile has the largest bounce rate B2B followed by telecom.

But are we trying to find answers to questions like why close to 50% of users across industries are leaving?
Are we showing something that the consumer never expected?
Is the website site design confusing or from the stone age?
Is the website takes forever to load?
Is the website has enough pops to make the user blind?
And finally how effective is the mobile experience? With almost 50% of mobile users bouncing after viewing just one page, there’s clearly still some work that needs to be done to create a mobile-first world.
The answers to the above questions also connect with the May 2021 update from Google that now favours sites with top-performing Core Web Vitals in search results.
“The new page experience signals combine Core Web Vitals with our existing search signals including mobile-friendliness, safe-browsing, HTTPS-security, and intrusive interstitial guidelines.”
Further Search Engine Land had to say on the update:
“The page experience update introduces a new signal that our search algorithms will use alongside hundreds of other signals to determine the best content to show in response to a query. Our systems will continue to prioritize pages with the best information overall, even if some aspects of page experience are subpar. A good page experience doesn’t override having great, relevant content.”
Contentsquare data also worked on the Google update and found out -
“A 100 ms delay in web load time can cause conversion rates to drop by 7%. Additionally, a 2-second delay in page load times can more than double a site’s bounce rate.”
Now we have the answer to why 1 in 2 visitors are leaving the site.
Page experience
Contentsquare monitored the homepages of 2,000 leading online websites from 11 industries every day from January 9 to January 26, using desktop and mobile testing sites in the U.S., U.K., France, and Hong Kong (China). This is what the data says:
While Google PageSpeed Insights recommends websites have a server response time of under 200 milliseconds (ms), data found that no industry met that standard. Most websites come in around the 350 - 450 ms mark.
Time to first byte (TTFB) indicates the time elapsed between the sending of the request requiring the web page and the reception of the first data by the user (the HTML code of the related web page).
The median across all industries was 494 ms. However, across all industries, the median mobile TTFB was 1049 ms, or +112% slower compared to the median desktop time. This is a trend that all industries will want to make note of, especially as more and more users use their smartphones to discover, research, and try new goods and services.

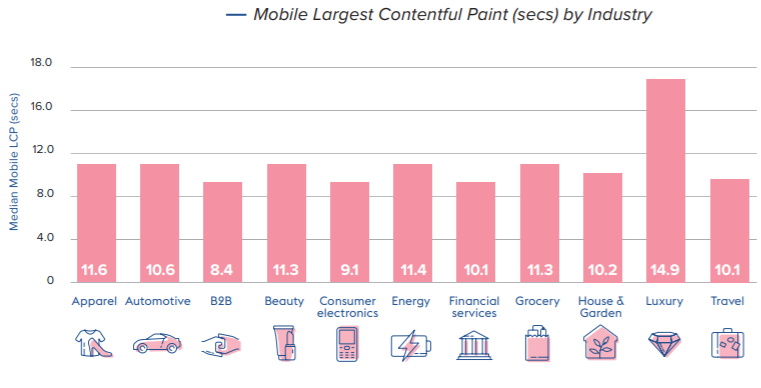
Largest Contentful Paint (LCP) is defined as a parameter that evaluates loading performance by measuring the time it takes for the largest content block to appear on a screen. While an LCP of 2.5 secs or less is ideal but LCP across all industries for desktop was 4.6 seconds, almost double the suggested rate, and 10.6 seconds for mobile.
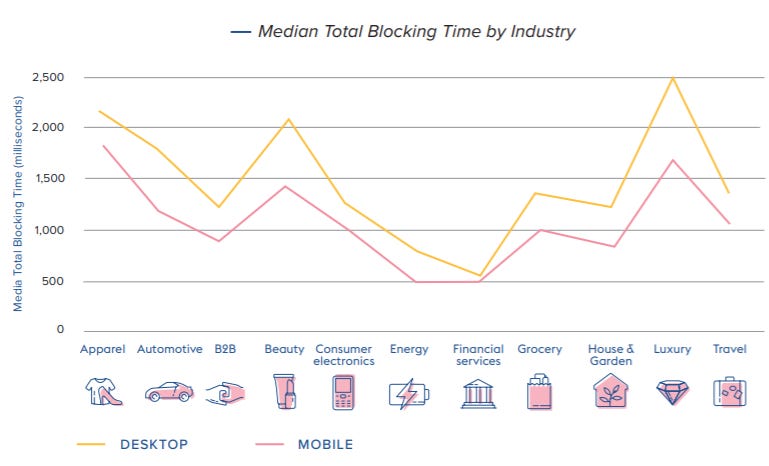
And the Total Blocking Time (TBT) measures the total amount of time that a page is blocked from responding to user input (clicks, keyboard presses, etc) after the page has started to render content has a similar sad story to share.
For total blocking time (TBT), the data found websites on desktop had a median of 1355 ms to load and 993 ms on mobile. These TBT values present a large opportunity for improvement for online businesses, as they are well above recommended values.
“According to Google, a good TBT ranges from 0 to 300 ms, while sites in the 300 to 600 ms range are encouraged to improve their rates. Anything above 600 ms is considered a poor user experience.”
Also, make sure that Max Potential First Input Delay( is the theoretical maximum delay a user could experience when interacting with a page) between 0 and 130 ms. However, the industry FID for desktop experiences was 531 ms across all devices, while mobile was 447 ms.
Today’s digital landscape is so competitive that even a 2-second delay can push a user to abandon your site in favour of a faster experience.
Your digital transformation starts from your website and is mobile-first now. Next time when you speak to your website manager/agency you know what to question when you get a miserable bounce rate.