


Weekend Musings 22
Thoughts on Facebook 2022 Trends Report, FB Content Report Q1 2022, and 2022 M+R Benchmarks study

“Our dreams have got bigger. So have our expectations and our digitally enabled opportunities. People will redefine what success means and how they achieve it. We're reappraising traditional education and hybrid work while pursuing new careers and joining the creator economy,” says Facebook’s 2022 Trends Report.
Creator Economy
Post-COVID-19 Creator Economy is one of the trends on the rise. Every platform including LinkedIn has now a creator program. The recently launched 10-week Creator Accelerator Program will offer 200 shortlisted individuals additional resources and guidance from LinkedIn mentors.
Talking about the creator culture, Facebook informed: “63% of 18 to 34-year-olds trust what a creator says about a brand more than what the brand says about itself. It’s no surprise that creators are at the forefront of setting the tone for platform language, and brands that understand culture codes harness the power of creators to tell the stories they can’t tell themselves—benefiting from credibility and relevance by proxy.”
Influencer Marketing 2022 Marketers Playbook further adds that influencer marketing works.

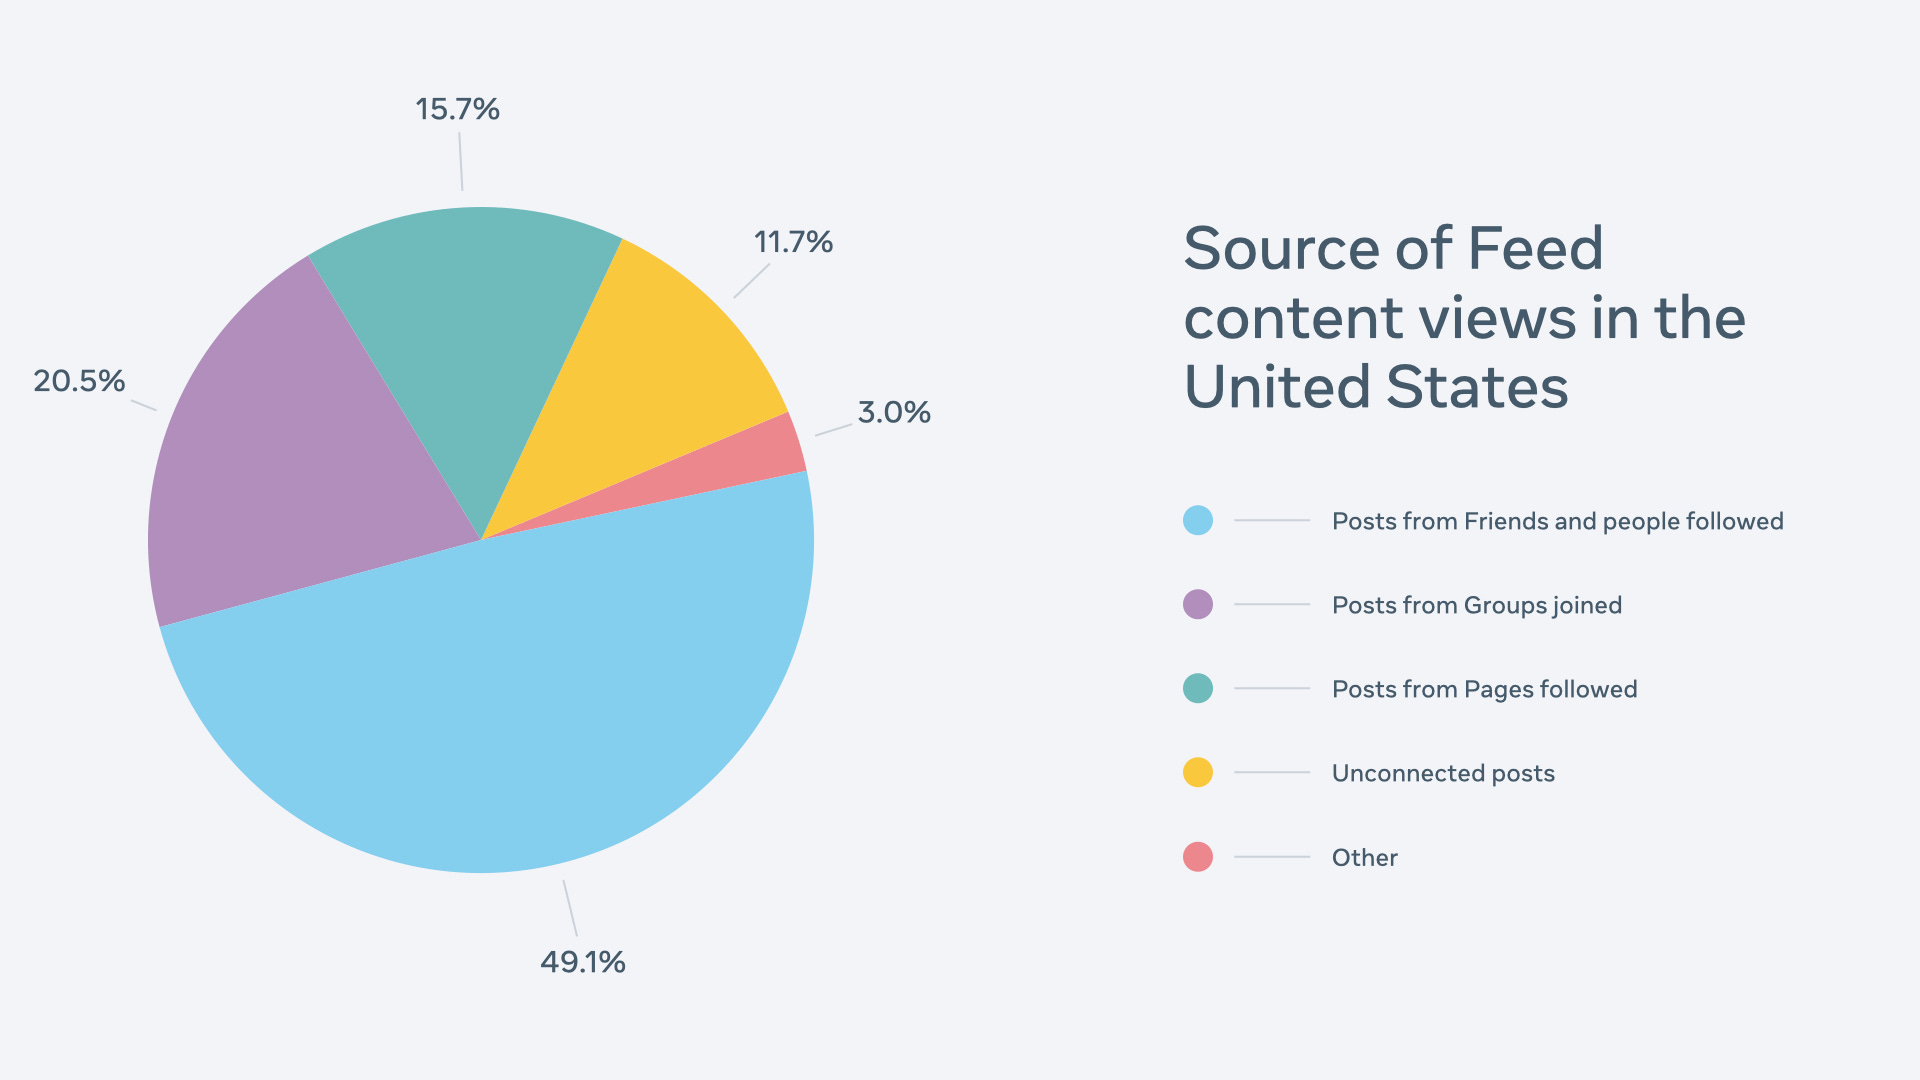
FB Content Report
Meanwhile, Facebook has released Content Report Q1 2022 - what people see on Facebook. This report shares data on views and viewers of content in Feed, including recommended content, seen in the United States between January 1, 2022, and March 31, 2022.
And this is what a typical newsfeed looks like in the US - In Q1 2022, 85.3% of views came from posts shared by people’s friends, from Groups people had joined, or from Pages they had followed (see breakdown below).
83% view posts with links and news content dominate these links. Additionally, the majority of the most-viewed posts on Facebook contained either a video, a photo, or text posts. They were related to entertainment and humour, similar to the prior Q4 2021 report. This is the most viewed content on FB in the US.
Facebook Lead Forms
If you have worked on the Facebook Lead Forms then you will definitely get a feel that you are working in a different era. While they are the backbone of Facebook Lead Generation campaigns but the forms need an upgrade and Facebook is doing so.
Lead forms work because they are easy to set up and the user details are auto-populated from Facebook. Well, this is also the reason to drive poor quality leads. What if the user has not updated his old phone number on Facebook. Meta says that you’ll soon be able to use responses to a multiple-choice question to help filter leads.
So survey-based campaigns could be a possibility with lead forms in the near future.
Additionally now on the Lead Forms, you can have a link to directly download a guide or whatever is the value exchange. Rather than redirecting the user to a website or landing page.
All these new Facebook Lead Form features are yet to be rolled out. But when will we have an edit option for a saved lead form. At the moment every time I edit a lead form, Facebook creates new versions.
State of Nonprofits Digital Program
“Nonprofits that receive more online revenue didn’t just invest more in digital ads than smaller groups; they invested four times more relative to their total online revenue,” says the 2022 M+R Benchmarks study.
The majority of digital advertising spending was devoted to direct fundraising asks — overall, fundraising accounted for 52% of all budgets. Branding, awareness, or education advertising made up 32% of budgets, with lead generation at 15%.
And Search Advertising accounted for 23% of Large nonprofit budgets, and 22% of Medium nonprofit budgets. For small nonprofits, the share of budgets devoted to Search was more than twice as large: 53% of all spending.

M+R shares: “For a nonprofit with a limited budget, it makes sense to invest as much as possible in channels that reliably produce higher returns. But there are limits to Search advertising — there are only so many search terms that are relevant to your nonprofit or cause, and only so many people searching for them. This is where Large and Medium nonprofits may be more likely to hit that limit and diversify into other channels with significant investments in Display, Social Media, and Video.”
Email Response Rates are a concern for Nonprofits. The average fundraising message response rate in 2021 was 0.08%. That means that a nonprofit would need to send emails to 1,250 recipients in order to generate one donation.
That 0.08% response rate was 11% lower than in the previous year. And we have the open rates that took off in a different direction - open rates went up by 26% in 2021!
If a much larger portion of the audience opened fundraising emails in 2021, why did a substantially smaller portion actually complete gifts?
Don’t ask us — ask Apple says M+R. False opens due to Apple’s move don’t lead to clicks or donations.
CauseMic’s 2022 Email Impact Guide for Nonprofits highlights another important fact - 80% of emails landed in Gmail's Promotion tab.
Finally, we have the website - Even as desktop users represented less than half of all website visits, they accounted for 65% of all donation transactions and 76% of all revenue. This is another way of saying that donation page conversion rates were higher for desktop users than for mobile users, and that desktop users had a higher average gift.
The proportions have shifted a bit over the past few years, but the basic story has held true: a visit from a desktop user was more valuable (in terms of direct revenue) than a visit from a user on a mobile device.
That’s all from my side. Have a happy weekend.
And by the way, if you are interested in understanding the difference between happiness gained by objects vs happiness gained by pure being or awareness then do watch Pravrajika Divyanandaprana Mataji’s Buddha at the Gaspump interview. It is a long conversation but I have shared the link where she answers the question with such clarity and bliss :)
She is a monastic member of Sri Sarada Math and specializes in Yoga-Vedanta.