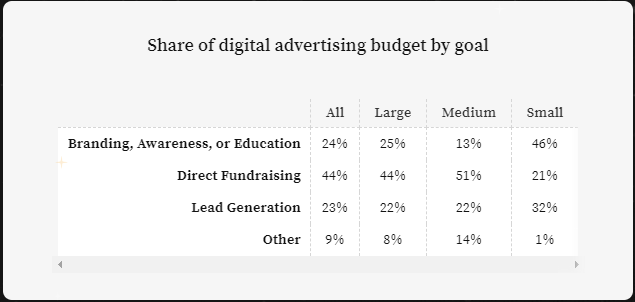
Nonprofit spending on digital ads increased by 17% in 2019, with nonprofits spending an average of $0.07 for every dollar raised in online revenue. These insights are part of the M+R Benchmarks 2020 study that was released earlier this year. The report also highlighted that direct fundraising ads accounted for 44% of all spending. Branding, awareness, or education ads accounted for 24%, and lead generation for 23%.
If you recall I have recently shared how Facebook Fundraising is an aspect that nonprofits can’t ignore. Even though the pressure from 350 brands (most recently joined by Target, Best Buy, Pfizer, and Volkswagen) start mounting on Facebook for its spineless behaviour against hateful content.
Read: Still ignoring Facebook fundraising
According to the M+R study Facebook giving generated 3.5% of all online revenue for nonprofits in 2019. Overall, revenue raised on Facebook increased by 6% over the previous year.
The vast majority of all Facebook revenue (97%) was donated through the peer-to-peer Facebook Fundraiser tool.
The report also highlighted the growing acceptance of digital advertising along with the owned mediums nonprofits own. Digital advertising spending increased by 17% from 2018 to 2019. For many nonprofits, digital ads are an increasingly important way to boost visibility, acquire new donors and prospects, and coax additional giving from identified supporters.

But not everyone is following the same trajectory: while Large nonprofits (those with annual online revenue over $3 million) increased ad spending by 32%, Small nonprofits (those with annual online revenue under $500,000) decreased their spending by 25%.
The report was concluded after 201 nonprofits provided insights and data.
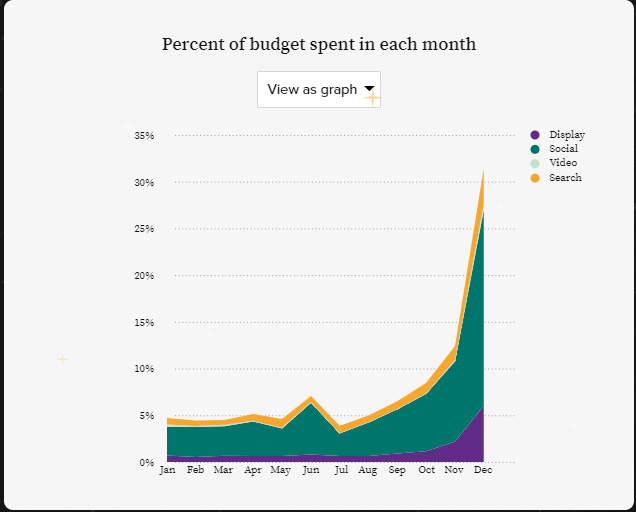
While the advertising budgets were not distributed evenly but the below graph shows how nonprofits have invested in Search, followed by Social ads. And the trend has been consistent all throughout 2019. Not surprised because I strongly feel that the nonprofit category will be dominated by search behaviours.
Direct fundraising (44%) has been the goal by almost all nonprofits except the smaller ones who are trying to invest in goals like branding and awareness. The differences may partly be explained by the different opportunities and needs for nonprofits of different sizes, but it also may reflect differences in channels.
Large nonprofits invested 35% of their fundraising ad budgets in Display ads (e.g. banners), and 54% in Social Media ads, with a smattering of Search, Video, and other channels. Small nonprofits spent nearly all of their fundraising advertising budgets—96%—on Social Media ads.
The report also states that Search had the lowest cost per donation (CPD) at $39, less than half the $82 Cost Per Day for Social Media, which is significantly lower than the $142 for Display.
The differences are not quite so clear-cut when we look at Return on Ad Spend (ROAS): the revenue directly sourced to each dollar of ad spending. Once again, Search stands out with by far the highest return at $3.59 ROAS. But overall, Display ads performed similarly to Social Media ads, with ROAS of $0.74 and $0.70, respectively.
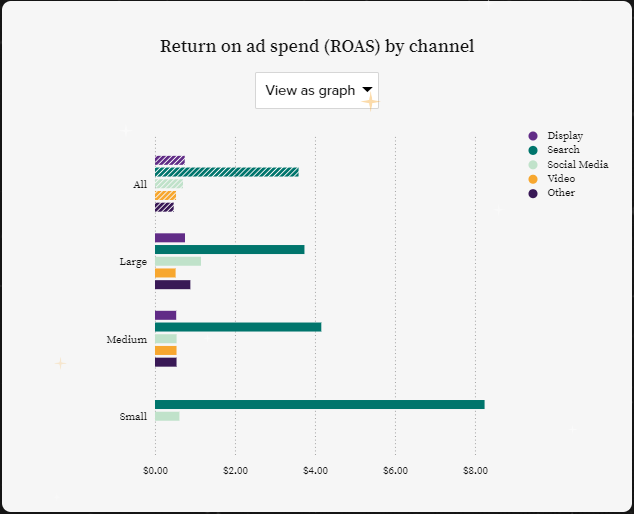
Search stands out but it is wise to invest your money accordingly and make corrections depending on the data. Every nonprofit has a different story and there is no fixed advertising spend template.
Don’t ask how much should I invest in paid or social ads. Ask yourself how much budget you have. Ideally, put 20% of your marketing budget into digital. I believe in investing small and growing it depending on your data.
Getting a supporter to click on a direct donation link is not the only way to use digital ads to boost revenue. View-through revenue accounted for 43% of all digital ads giving.
The report further states that: “These are donations from supporters who have been served an ad, but who arrived at the donation page through some other means. Which is to say, viewing the ad may have helped drive their gift—it made them more likely to search for a nonprofit or cause, open an email, or otherwise make their way to give.”
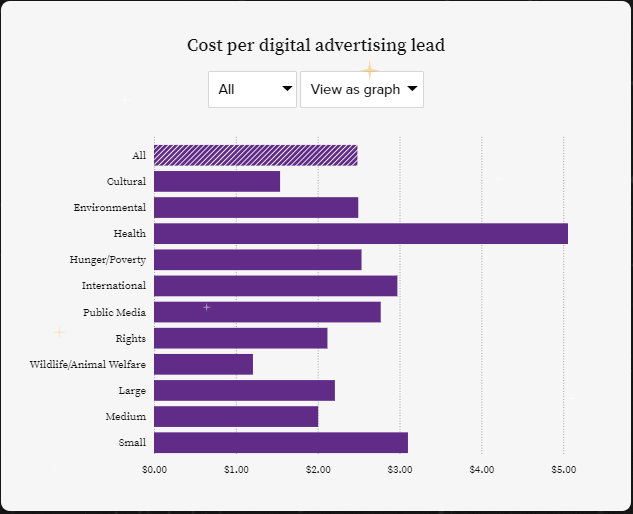
On average, the cost to acquire a new lead through digital advertising was $2.49.
The report makes an emphasis on Facebook posing challenges for nonprofits seeking to reliably make contact with their supporters. The overall Earned Reach Average (the number of Facebook users reached by a given post relative to their audience size) for an organic post was 0.091. That means that a nonprofit with 100,000 followers could expect to reach just 9,100 users with a given post.
This marked a 16% decline from 2018, a drop that far outpaces the modest 4% average increase in the number of Facebook followers.
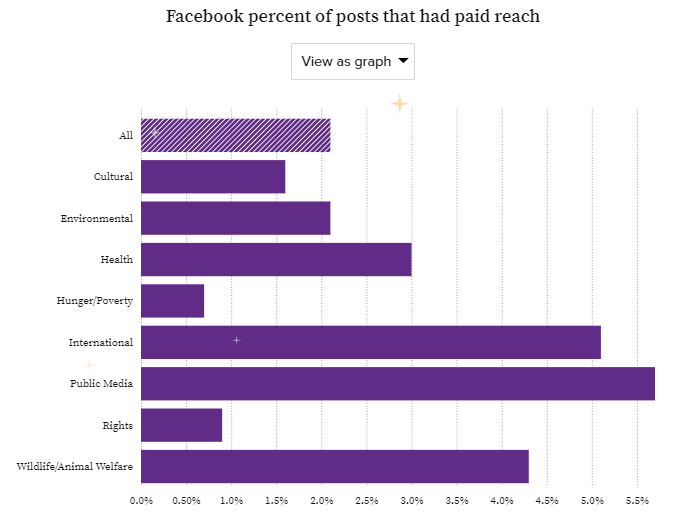
Public Media and International categories were severely affected by the engagement drop on Facebook so they invested money in Facebook paid reach(2019) and got the desired results. Additionally, Public Media has been leading when it comes to spending on digital advertising.
Have money then by all means experiment but if you are nonprofit with cash crunch(I am yet to find an NGO that would say money isn’t a problem) so invest your money wisely when it comes to digital advertising and work aggressively on building your owned mediums.
P.S. Thank You for supporting my COVID19 fundraising campaign. I say this with a lot of love and respect to each one of you who has supported in whatever way they could.
May peace be with you ♥️


