


Where does the digital experience of your brand stand
Thoughts on the web experience, earned acquisition, user frustration, and engagement of digital experiences for-profit and nonprofit organizations

Harish is my hairdresser. Okay, my barber. A young guy who talks to me in Telugu and updates me about all regional movie gossips. Once a month I visit him to trim myself and check my handicapped Telugu.
Then came the pandemic that changed everything for all of us. Once the lockdown was relaxed in Bangalore, I paid him a visit. Harish was all excited to share all the gossips with me. But before he started his quota, he told me to take his mobile number. “Leave me a Whatsapp message. I will come to your flat whenever you fancy a haircut. I did the same for people in your society during the lockdown.”
I prefer to visit the shop. It’s been two months since I have tested my Telugu.
Last weekend, while driving in the lanes of Koramangala my brother showed me a dead lane. There was a time when you couldn’t drive through the lane in the evenings, forget parking. Both sides of the road once had bars and restaurants. Today the lane is dead.
“ITC Gardenia is on Swiggy,” remarked my brother. “Now when you pay ₹2000 for a butter chicken delivered by Swiggy. You no more see the fine dining experience. You ask yourself what is wrong with the ₹200 butter chicken delivered by the local Punjabi restaurant.”
By the time I would publish this article possible by 6:30 in the evening, Mercedes Benz will be home delivering my brother a brand new GLC SUV.
And I have been asking my bank account can we buy a cycle.
My bank account running on low reserve: “Sure why not. What is that you can sell?

Anyway, coming back to my point, he didn’t view the car on digital or looked into its digital experience. Talking about the Mercedes Benz digital experience is simply website integration with Whatsapp. You can book a ride, get product details and etc. The website shows models and interiors but in a static fashion.


BMW India is miles ahead. With BMW Contact Less experience you can build your own BMW model, with a 360-degree view and book it from your comfort of the home. MG Motors India also has a similar contactless feature.
However, my brother walked into the store and booked it. Even if Mercedes had a digital experience option he would have gone offline to book it and take a test ride.
Age-old habits don’t change all of a sudden. Not even if Mckinsey keeps publishing reports every month.
Digital experience for-profit organizations
Digital experience does matter when digital has become a go-to medium. I am not discounting other mediums. Will this be the same in the post-pandemic world? I don’t know what we mean by a post-pandemic world and will the habits change.
Site/Web experience
What I know for sure is that digital experience starts from your website and your load time is the ice breaker.
Various industry sources have found that over 50% of mobile users leave a site that takes longer than three seconds to load. And according to Content Square data we have seen a direct correlation between loading time and the number of pages viewed per session - 20% longer loading time means 20% fewer pages viewed.
Overall, the average loading time across all industries is 2.39 seconds, financial services (2.91s), and energy (2.81s) with the slowest average loading time. More eCommerce focused industries like apparel (1.91s), grocery (2.01s) are the best performing when it comes to page load time, and also see significantly more pages viewed per session as a result.
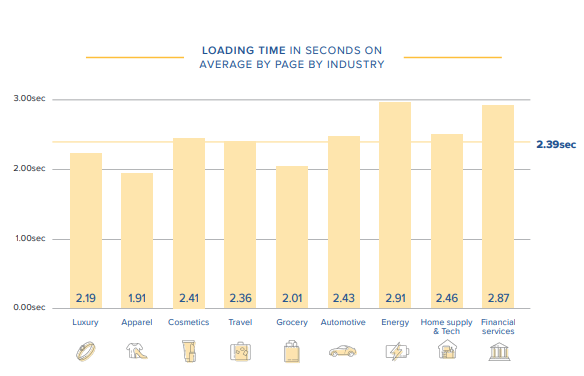
With mobile users proven to be more impatient than desktop users, this should be an important focus for 2020 in these industries.
The below image shows the faster the load time, the greater has been page views per session. I understand that there are other factors when we consider categories such as Grocery and Apparel. The time spends on both these categories are far more compared to other categories.

The above data is part of the 2020 Digital Experience Benchmark Report published by Contentsquare. The report has analyzed over 7bn user sessions, based on 12 months of Contentsquare data from 400 global websites in 9 different verticals.
Google - the sole owner of your web experience wants a better web compared to a faster web. Just because AMP didn’t go by the way Google had envisioned it, doesn’t mean page experience is out of the picture. Page experience is part of the entire better web vision of Google.
Along with the Core Web Vitals, Google is considering factors like mobile-friendliness, safe-browsing, HTTPS-security, and intrusive interstitial guidelines, to provide a holistic picture of page experience.
Earned acquisition source
Earned traffic (organic search, direct traffic, referrals, etc.) remain the backbone of your website. 65% of web traffic comes from earned sources cross-industry.
The financial services and energy industries — two markets still very much on the path to digital maturity — get a huge share of their traffic from earned sources (83% for energy, 80% for financial services).

The travel sector is still spending big on the acquisition, with nearly half of the traffic coming from paid sources (49%), while the luxury/apparel/beauty trinity averages around 40% on paid traffic - these are all sectors heavily reliant on advertising against competitors and price.
Bounce rate and content unseen
The bounce rate is often used as an indicator of a website’s stickiness or attractiveness. The scary news is that almost half of visitors to a site abandon their journey after seeing only one page. On mobile, the cross-industry average bounce rate is 51%, with desktop 43% and tablet 45%.

The report further highlights that 69% of all content unseen across all industries. This is particularly notable in the financial services (75%) and beauty (74%) industries where three-quarters of the website are unseen by users.

The Blog Benchmark 2020 report published by Animalz also shares: “The median bounce rate across the dataset was 80.33%. Put another way, four out of five readers left after just one article.”
Animalz says: “This is not necessarily a bad thing. When the bulk of your traffic is driven by organic search (as our research shows), readers are coming to your site for a specific reason, not to browse. Search-focused articles are situationally useful and provide point-in-time value. There’s little incentive to click around if an article has done its job.”
The digital experience for nonprofit organizations
Users visiting nonprofit organizations online showcase high frustration and below-average engagement. I am not surprised. However, nonprofits are missing out big time especially when people are wanting to give online.
According to Decibel, online donations grew by 12.1% while fundraising revenue grew by 23%.
It’s clear more and more donors want to make their contributions online, which means non-profit organizations must ensure a seamless digital experience to drive more funding – or they could miss out.
Well, nonprofits are missing out.
Frustration is killing digital fundraising
Decibel Digital Experience and Conversion: Industry Benchmarks for 2021 study crunched a sample size of 4.1 billion users across 11 different industries over 2020. The below screengrab looks at the overall quality of digital experiences across all 11 industries.
Telecoms and automotive are the low performers here, with user sessions in those industries averaging out to a Digital Experience Score (DXS®) of just over 5.8/10. Restaurants, meanwhile, is the top performer with the quality of experiences averaging to a DXS® of 7.5. Nonprofit organizations perform slightly well.
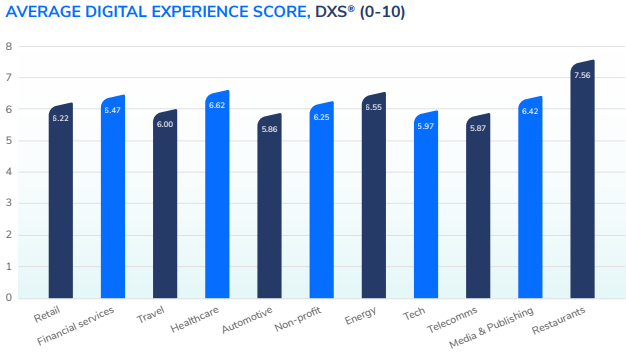
However, the report states that high user frustration is experienced throughout the sector, with lots of rapid scrolling, low engagement, and a poor navigation score with lots of users refreshing page.

With 8.2% of page views containing instances of user frustration, non-profit generally performs poorly against the 6.5% average of other industries.
It has a relatively low occurrence of bird’s nest behavior, which refers to when a user rapidly shakes their mouse in confusion, unresponsive multi clicks, which typically occur on broken links or buttons, and repeated device rotation, the result of content not fitting the screen.
However, it has a high incidence of rapid scrolling per user session, which in certain contexts signals user frustration.
How do you reduce user frustration?
Invest in a simple and donor-centric website
Create frictionless donation pages with zero donor anxiety
Less user engagement and user journeys
With sessions having an average Engagement Score of 4.48/10, non-profit performs slightly worse than the 4.6 average of other industries.

It has slightly more incidences of reading behavior, which refers to users following content with their mouse, and slightly fewer instances of select and copy behavior; but performs poorly on responsive multi clicks, which refers to users clicking through a responsive element like an image carousel.
The study also shares that fine-tuning the most ‘traveled’ user journeys matters most when it comes to turning user traffic into donations. Without the common user journeys in place, any organization is running around like a headless chicken.
With an average Navigation Score of 9.1/10, non-profit performs poorly against the 9.4 average of other industries. Per page view, the on-page refresh rate is high at 35%, suggesting performance issues.

However, in terms of the journey, the revisit rate of pages is just 22.6% against the 32.6% average of other industries – suggesting non-profit customers are generally finding what they need on each page, without having to look twice or cover old ground.
The digital experience starts from the website or the app depending on the nature of the business. Let’s make it a simple and intuitive experience for the consumer.
And not the way Maketoonist said in 2017.
