


Online giving in 2019 grew 6.8% year over year for the 5,204 nonprofit organizations in the analysis.
The Charitable Giving Report 2019 is a research done by the Blackbaud Institute which further states that in 2019, 8.7% of total fundraising came from online giving.
In terms of percentage of total fundraising that comes from online giving, Animal Welfare, Arts and Culture, Faith-Based, and K-12 Education organizations have all now crossed over the 10% threshold in their online giving programs.
When it comes to online giving by size the report states: “Nonprofit organizations of all sizes had positive online giving growth in 2019 compared to 2018.”
The below image shows the growth for small, medium, and large nonprofits. Taking a more longitudinal three-year view of fundraising from the same organizations revealed a 9.6% increase in online giving.

Encouraging to see small and medium nonprofits putting faith in online giving. And with the ongoing pandemic this year, my assumption is that the faith in online giving will show results.
The same was observed in the total fundraising from online giving by size. Small nonprofits continue to grow their digital fundraising programs with 14.1% of total fundraising coming from online giving. Medium-sized organizations were 7.7% and larger nonprofits remained at 4.0% in 2019.

Overall giving in 2019 grew 1.0% on a year-over-year basis for the 8,210 nonprofit organizations in the analysis.
In 2019, charitable giving in the United States grew 1% based on a meticulous analysis of $36.3 billion in donations by the Blackbaud Institute. Online giving grew by 6.8% compared to 2018 after analysis of $2.7 billion in online donations.
Taking a longer view of the trends by subsector, the report highlights that nonprofit organizations in the Environment, Animal Welfare, International, and Public and Society Benefit subsectors have the best three-year giving trend performance.
This year’s report also measures the average donation size by subsector.
Across all subsectors, the average donation amount is $617.
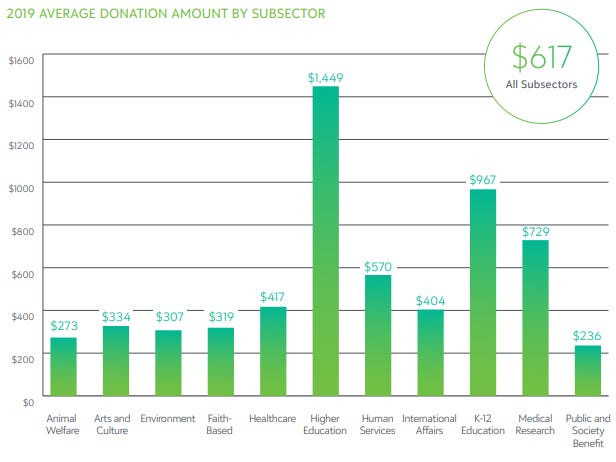
There is a significant variance among different subsectors. This is attributable to organizations with a larger number of major and principal donations from donors. For example, Higher Education organizations have an average donation of $1,449 compared to $273 for Animal Welfare nonprofits.
The average online across all subsectors is $148.

Just like with overall giving, there is a wide variance in the average online donation amount among the subsectors. “This analysis includes all donations, including large major donations, which could also account for the higher numbers in some subsectors,” according to the report.
(For more insights on how various trends are affecting one of the subsectors, dive right here. Blackbaud has done massive research.)
Mobile plays an important role in online giving according to the study. In 2019, an estimated 26% of online donations were made using mobile devices. This has grown steadily since 2014 when it was just 9% of online donations.

It goes without saying that Nonprofits need to provide the mobile experience to the donor across various touchpoints. This includes mobile-friendly websites, email, and donation pages. While the majority of nonprofits understand the importance of mobile but there are major gaps.
According to the CauseMic’s research of 152 nonprofit organizations:
“While 83.3% of nonprofit donation pages were optimized for mobile, but 16.7% were only available on desktop, adding an additional barrier to the check-out process for those who prefer to give on the go.”
With the growing percentage of online giving, online-only donor retention becomes crucial. It is a direct, quantifiable reflection of how you are engaging your donors and communicating your mission and your online presence can amplify these aims.
In addition to this, Blackbaud highlights another growing trend: Maintaining the donor’s personal and financial data in accordance with privacy best practices.
“Donors are more critical of how their data is being managed than ever before, and carefully stewarding their data is now an important part of stewarding the overall donor relationship.”
The same was highlighted by the Salesforce nonprofit trends report 2020 - trends, challenges, and opportunities with technology. “69% of nonprofits say the demand for transparency regarding funding has increased.”
Transparency is a key issue when it comes to client experiences and programs. 26% of nonprofits say that a lack of transparency and trust directly holds them back from achieving their mission.
How is your relationship with transparency?
Not everyone will have the budget for a Salesforce product. But there are other ways too.
Here is how 5 nonprofits are dealing with transparency on their website.