


Website, Social Media and Email performance for Nonprofits
Insights from M+R Benchmarks Study 2021

“Half of all nonprofit website visits came from users on mobile devices. The traffic share for mobile devices increased by 9% in 2020.”

The above data is from the recently revealed 2021 M+R Benchmarks Study. “A total of 220 nonprofits representing a wide range of causes contributed time, data, and thoughtful responses to hard-hitting questions.”
In my earlier article, I shared my thoughts on Digital Ads from the report. Today I am going to share my thoughts on how Nonprofits faired on mediums like Website, Social Media and Email.
“Nonprofit spending on digital ads increased by 33% in 2020, with nonprofits spending an average of $0.10 for every dollar raised in online revenue. (This is a measure of the level of spending relative to the total budget, not a direct measure of return on investment.”
Last year the M+R Benchmark Study 2020 informed that the Nonprofit spending on digital ads increased by 17% in 2019, with nonprofits spending an average of $0.07 for every dollar raised in online revenue.
Website performance
In 2020, mobile users accounted for 50% of all website traffic, compared to 44% for desktop users and 6% for tablets. Even though mobile visitors generated half of all web traffic, they made 35% of the donations and accounted for 25% of the revenue.
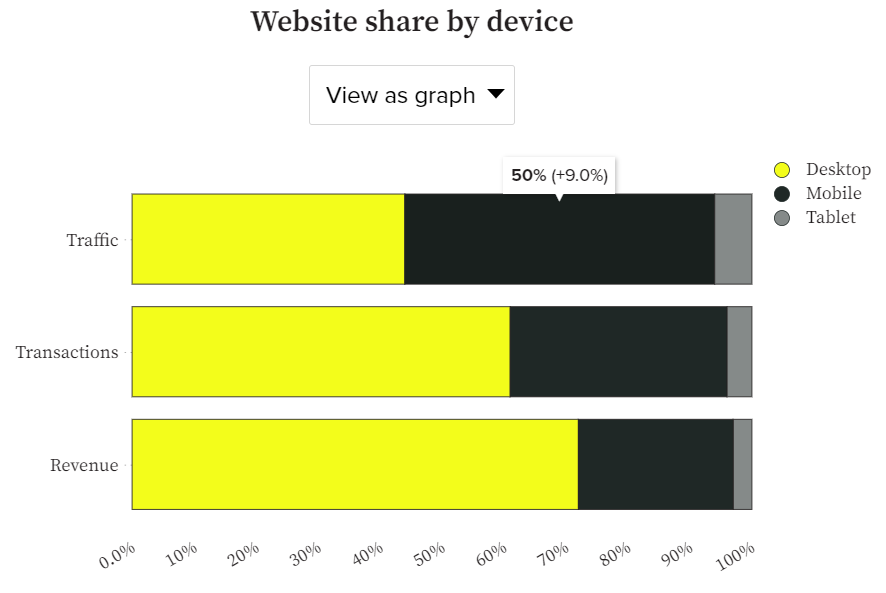
Not every visit converts to a transaction on the web. However, if you see the above data it shows that desktop users, while a declining share of overall traffic, were more likely to complete a gift, and their gifts were likely to be in larger amounts.
The website main donation page conversion rate for desktop users was 12%, compared to just 9% for mobile users. (Tablet users had an 18% conversion rate, but they are such a small share of overall traffic that we’re not going to get too excited about that number.) The average gift for a donation made on a desktop device was $80, nearly twice as high as the mobile average gift of $42.
Consumers have adopted mobile faster than marketers and the pandemic has just taken the trend forward. So it is obvious that the mobile traffic is high but why are the mobile transactions are half compared to the web. The answer is simple Nonprofit organizations don’t provide a mobile-first experience.
Most of them don’t have a mobile optimised site and if they do they don’t treat web and mobile differently.
Additionally, the study states: Organic traffic accounted for 42% of all nonprofit website traffic. “Organic traffic” includes only visits from users who arrived via unpaid search results. It excludes visits driven by social media posts, direct response marketing like email, and paid search, social, or display advertising.
For many nonprofits, organic traffic represents the majority of all visits — both the Health and Wildlife and Animal Welfare sectors reported over 50% organic traffic.
But how much revenue does the organic traffic generate: Of all organic website visitors, 0.08% completed a gift. The average revenue generated by an organic website visitor was $0.12.
Social Media = Facebook
No surprises here.
For most nonprofits, Facebook continues to be the social media platform with the largest follower base. In 2020, nonprofits had 817 Facebook fans for every 1,000 email subscribers, 291 Twitter followers, and 149 Instagram followers.
On Facebook, an organic post by a nonprofit reached just 4% of fans in 2020.
The vast majority of a nonprofit’s Facebook fans simply didn’t get served any individual post. So the only option that remains is paid promotion. In 2020, 2% of nonprofit Facebook posts had paid reach.
Engagement on Facebook has declined. The study calculated that in 2020 the average Facebook engagement score was 0.32%.
Which is to say: if a nonprofit had 100,000 fans and posted a piece of content, that post would receive 320 likes, clicks, and shares on average.
But the 0.32% engagement score marks a decline of 21% from 2019 levels. At the same time, Facebook engagement scores were highly variable across sectors. Health nonprofits saw engagement rise by 537%, which may seem intuitive in a year dominated by a pandemic.

Photos and videos drive the most engagement on Facebook.
While Facebook might have become the walled garden of paid posts but the revenue from Facebook Fundraising has increased by 14% in 2020. Hunger and Poverty nonprofits reported a 946% increase in Facebook Fundraiser’s revenue.

The average Facebook Fundraiser generated four gifts, with an average gift size of $34. All those individual efforts, those donated birthday posts and neighbours helping neighbours and long-lost high school classmates chipping in, accounted for 1.3% of all online revenue.
Email - dead? not yet
The report defines this section with a one-liner and it is my favourite:
“The 2020 data shows that reports of email’s demise have been greatly exaggerated. Again.”
Nonprofits sent more email messages to more people last year. Email volume increased by 17%, with 59 messages sent per list member over the course of the year.
Of these, 23 were fundraising messages, 9 were advocacy messages, 12 were newsletters, and 15 were “other,” which might include cultivation messages, event invitations, polls and surveys, or anything else.

According to the study: Overall open rates increased by 9%, to 21%. Unsubscribe rates declined by 5%, to 0.18%. And response rates increased for both advocacy messages (to 3.6%) and fundraising messages (0.10%).
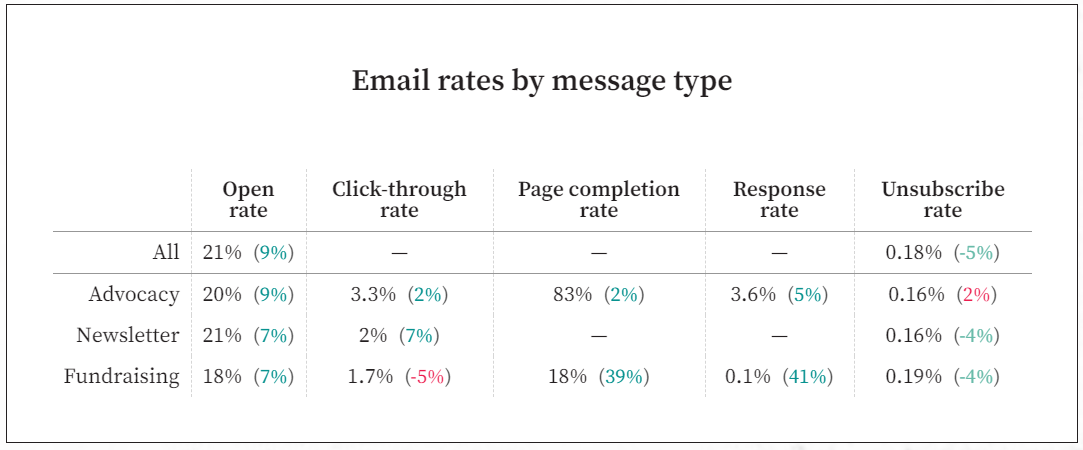
If you compare the message type and the email rates then you would notice that Nonprofits sent more fundraising emails and the click-through rates for such emails dipped to -5%.
This is obvious when you have not nurtured your community or not gained their trust and all you want is money. Obviously, the pandemic was one of the reasons but nobody wants to give their hard-earned money for the sake of a good cause.
However, the study found out that donor audiences tended to have a slightly higher open rate than prospect audiences: 22% compared to 18%. However, click-through rates for fundraising messages were actually higher for prospect audiences. For audiences comprising donors, the average fundraising message click-through rate was 1.6%. For prospect audiences, it was 1.7%.

The differences are not large.
“For a nonprofit looking to make prospects look more like donors, the solutions may not be easy to find. But the landing page itself, and user behavior there, is certainly a place to start looking — and testing,” says M+R Benchmarks Study 2021.